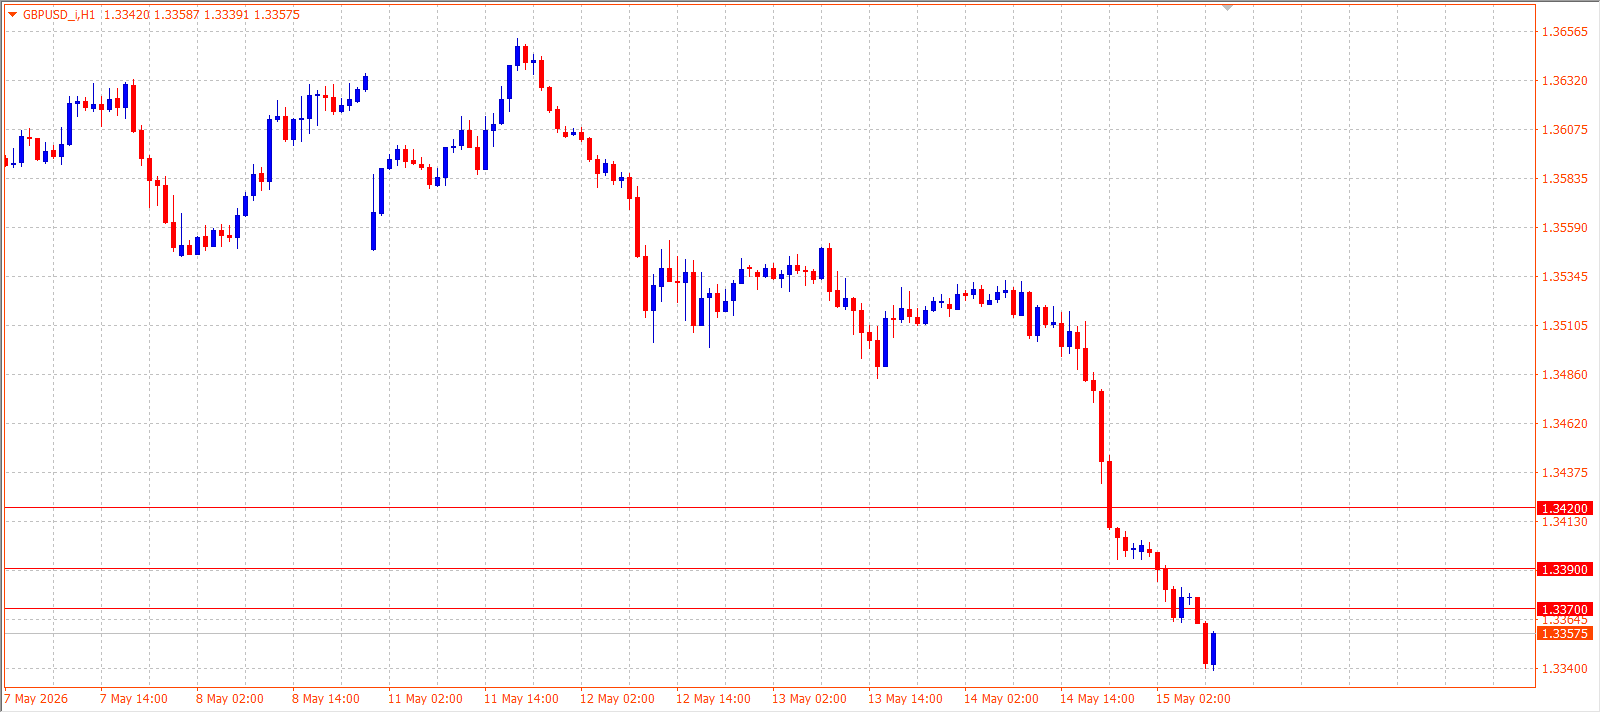
The GBP/USD pair starts the day in a much weaker technical position after a sharp breakdown that turned a previously neutral range into a fresh bearish leg. On the H1 chart, the decline is broad and persistent, with the pair unable to build any meaningful recovery after breaking lower. This type of structure often keeps pressure elevated throughout the session because former support levels tend to switch into resistance, limiting upside recovery. The market is now trading close to the lower edge of the recent move, which means the broader direction remains down, although intraday volatility may briefly increase as traders test whether the latest selloff has already become overstretched.
Current price: 1.33453
Pivot: 1.3370
Nearest support levels: S1: 1.3330, S2: 1.3315, S3: 1.3295
Nearest resistance levels: R1: 1.3370, R2: 1.3390, R3: 1.3420
Note: If the pair remains below the pivot at 1.3370, sellers are likely to retain control and continue pressing toward 1.3330. A breakdown there would strengthen the bearish case for an extension toward 1.3315 and possibly 1.3295 later in the session. If the market manages to rebound above 1.3370, a corrective move toward 1.3390 may develop, while 1.3420 stands as the next major resistance barrier for the day. Still, the current chart structure suggests that recoveries are likely to face renewed selling interest unless the pair can reclaim the 1.3390–1.3420 zone on a stable basis.